


Today, website performance is no longer just a technical checkbox. Google’s Core Web Vitals (CWVs) provide a standard framework for measuring user experience.
They help site owners and developers understand, through real performance data, how visitors experience their pages.
You only have 2 to 8 seconds to capture a user’s attention when they land on your website.
If you have what users are looking for but your website is slow, they may leave. As a result, you can lose rankings and organic traffic.
So, let’s talk about how to improve the Core Web Vitals of your website.
What Are Core Web Vitals?
Core Web Vitals are three performance metrics Google uses to measure how real users experience a web page. They focus on loading speed, responsiveness and visual stability.
The three current Core Web Vitals are:
- LCP (Largest Contentful Paint): how quickly the largest visible content element loads.
- INP (Interaction to Next Paint): how quickly the page responds when someone clicks, taps or types.
- CLS (Cumulative Layout Shift): how stable the layout stays while the page loads.
Google recommends that site owners achieve good Core Web Vitals because they are part of the broader page experience signals used by Google Search. However, good Core Web Vitals do not guarantee strong rankings on their own. They are one part of the overall search experience, alongside content quality, relevance and other ranking systems.
| Metric | Type | What It Measures | Good | Needs Improvement | Poor |
|---|---|---|---|---|---|
| LCP (Largest Contentful Paint) | Core Web Vital | Loading speed of the largest visible content element | ≤ 2.5s | 2.5s to 4s | > 4s |
| INP (Interaction to Next Paint) | Core Web Vital | Responsiveness to clicks, taps and keypresses | ≤ 200ms | 200ms to 500ms | > 500ms |
| CLS (Cumulative Layout Shift) | Core Web Vital | Visual stability and unexpected layout movement | ≤ 0.1 | 0.1 to 0.25 | > 0.25 |
| FCP (First Contentful Paint) | Supporting metric | How quickly the first visible content appears | ≤ 1.8s | 1.8s to 3s | > 3s |
| TTFB (Time to First Byte) | Supporting metric | How quickly the server starts responding | ≤ 0.8s | 0.8s to 1.8s | > 1.8s |
PageSpeed Insights also shows supporting speed metrics such as First Contentful Paint and Time to First Byte. These are not Core Web Vitals themselves, but they are useful because they help explain why LCP or the overall loading experience may be slow.
Google evaluates Core Web Vitals at the 75th percentile of real user data. This means the score is based on what a large share of real visitors experience, not just an average lab test. To pass Core Web Vitals, at least 75% of measured page loads should fall within the “good” range for each metric.

To pass, 75% of your users need to fall within the “good” range.
How to Check Your Core Web Vitals?

Before you fix anything, you need to know where you stand. The best way to do this is by using PageSpeed Insights, a completely free tool from Google for checking page speed. Just enter your website URL, and it will show you two types of data:
- Field Data (real user monitoring): This comes from the Chrome User Experience Report (CrUX) and reflects what actual visitors experience on your page. This is the data Google uses for SEO rankings. If your page has enough traffic, you will see field data at the top of the report with green, yellow, or red indicators for each metric.
- Lab Data (simulated): This runs through Google Lighthouse in a controlled environment. It is useful for diagnosing specific issues, but it does not reflect real user experience. A page can score 95 in lab data and still fail in the field.
Always check the field data first. If it shows green across all three metrics, your Core Web Vitals are passing, and you can move on. If any metric is yellow or red, that is where you should focus.
How to Improve Largest Contentful Paint (LCP)
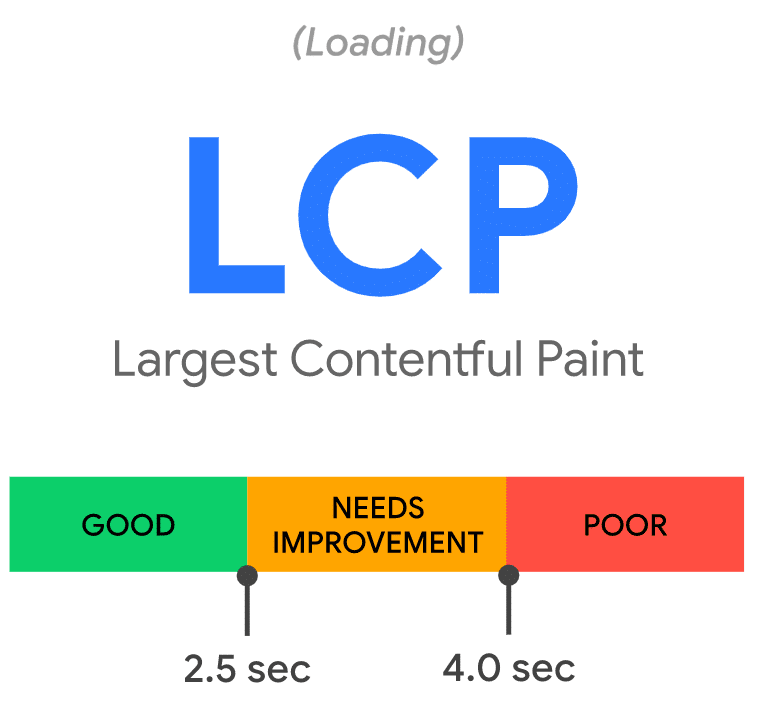
Largest Contentful Paint measures the time it takes for the largest image or text block to become visible within the viewport. It is the most important metric for page load speed.
1. Find Out What Your LCP Element Actually Is

Before changing your HTML source, use the “Diagnostics” section in PageSpeed Insights to identify the LCP element. It is often a hero image or an H1 heading.
2. Optimize That One Image
Image optimization is one of the most effective ways to lower LCP. Use modern formats like WebP or AVIF, and implement responsive srcset attributes. Also, make sure you are using CDN for better page load time and to reduce latency.
3. Remove Render-Blocking Resources
Excessive CSS and JavaScript frameworks delay the First Contentful Paint. Inline your critical CSS, and use defer or async for non-essential scripts.
4. Speed Up Your Server Response
If your Time to First Byte (TTFB) is high, your page cannot load quickly. Improve this by using server-side rendering (SSR), edge caching, and efficient API design to reduce database wait times.
If you are on WordPress, make sure to update the version to WordPress 7 which includes performance defaults that handle many of these optimizations out of the box, including lazy loading for below-the-fold images, modern image format support, and script deferral.
How to Improve Interaction to Next Paint (INP)?
Interaction to Next Paint measures how quickly your page responds when a user clicks a button, taps a link, or types in a field.
It replaced First Input Delay in March 2024 and is now one of the hardest Core Web Vitals metrics to pass. About 43% of websites still fail the 200-millisecond threshold.
The key difference from the old metric is that INP does not just measure the first click. It watches every interaction throughout the entire page session and reports the worst one at the 75th percentile.
So, a page that loads fast but has a laggy product filter or slow checkout form can still fail.
Why Pages Feel Slow to Interact With
Every user interaction goes through three phases. Understanding which phase is slow tells you where to focus:
|
Phase |
What Happens |
Common Cause |
|
Input delay |
The browser waits to process your click because the main thread is busy |
Third-party scripts, such as analytics, chat widgets, and ads, block the main thread |
|
Processing time |
The browser runs your event handler code |
Heavy DOM manipulation, complex state updates, and forced layout reflows inside handlers |
|
Presentation delay |
The browser renders the visual update after the handler completes |
Large DOM trees, complex CSS selectors, and excessive paint work |
The fixes that usually work
-
- Defer third-party scripts: analytics, chat widgets, ads and social embeds can block the main thread. Load non-critical scripts later where possible.
- Break up long JavaScript tasks: long tasks block interactions. Split heavy work into smaller chunks using techniques such as code splitting, requestIdleCallback or scheduler.yield where supported.
- Reduce JavaScript bundle size: remove unused code, lazy-load non-critical components and audit large dependencies.
- Simplify the DOM: deeply nested layouts and very large DOM trees can make visual updates slower after interactions.
- Test real interactions: do not only test page load. Test menus, filters, forms, buttons and checkout steps.
How to Improve Cumulative Layout Shift (CLS)

You can also check CLS in google search console. It measures how much visible content moves unexpectedly while the page loads.
A score below 0.1 is considered “good.” You know the experience: you are about to click a link, an ad loads above it, everything shifts down, and you tap the wrong thing. That is CLS in action.
CLS is often the easiest of the three metrics to fix. Most sites can improve it quickly with these changes:
1. Always Set Dimensions on Images and Videos
The number one cause of layout shift is media loading without clear width and height attributes. When the browser does not know how much space to reserve, it paints the text first. Then, when the image loads, it pushes everything below it downward.
Add width and height attributes to every <img>, <video>, and <iframe> tag. The browser uses these to calculate the aspect ratio and reserve the correct amount of space before the file downloads.
2. Reserve Space for Ads and Dynamic Content
Ads, cookie consent banners, email signup popups, and notification bars are common shift triggers because they inject content after the page has already rendered.
- Ad slots: Set a CSS
min-heighton the ad container before the ad script loads. Empty reserved space is better than a layout shift. - Cookie banners: Use a fixed or sticky position that overlays the page instead of pushing content down from the top.
- Web fonts: Use
font-display: swapand preload your critical font files so the browser does not reflow text when the custom font arrives. System fonts avoid this issue entirely.
3. Never Insert Content Above Existing Content
If you dynamically add a promotional banner, notification bar, or “breaking news” alert above the fold after the page loads, everything below it shifts. If you need to show dynamic content, place it in a fixed position or add it below the current viewport so nothing the user is already viewing moves.
What Should You Fix First?
If you have limited time or developer resources, start with the fixes that affect the most users and the most metrics.
- TTFB: if the server responds slowly, every loading metric starts late. Review hosting, caching, redirects, CDN setup and backend performance first.
- FCP: if users see a blank screen for too long, reduce render-blocking CSS, defer non-critical JavaScript and optimize font loading.
- LCP: optimize the largest above-the-fold element, usually a hero image, featured image or large content block.
- CLS: add image dimensions, reserve ad space and stop late content from pushing the layout around.
- INP: often the hardest metric to fix, especially on interactive pages. Start with third-party scripts, long JavaScript tasks and slow UI components.
Keep in mind that Core Web Vitals work more like a ranking tiebreaker, not a primary ranking driver. They will not push weak content to position one. But when two pages compete with similar content quality and backlink profiles, the faster one often has an advantage.
Sites that are losing pages from Google’s index should check whether poor Core Web Vitals are contributing to a broader user experience problem. Improving your click-through rate alongside Core Web Vitals can help build a stronger page experience profile overall.
Make Performance Part of Your Publishing Workflow
Core Web Vitals should not be checked only after a site becomes slow. They should be part of the normal publishing, design and development workflow.
Before adding a new plugin, ad script, tracking tag, landing page block or heavy media element, check how it affects real users. Small performance checks made regularly are easier than fixing a slow site after rankings, leads or conversions have already started to drop.
The goal is not to chase perfect scores. The goal is to make pages load quickly, respond smoothly and stay stable enough that users can focus on the content instead of the friction.


